Collection Insights
See how much of your catalog the AI agent actually uses, which collections carry the work, and which items customers see.
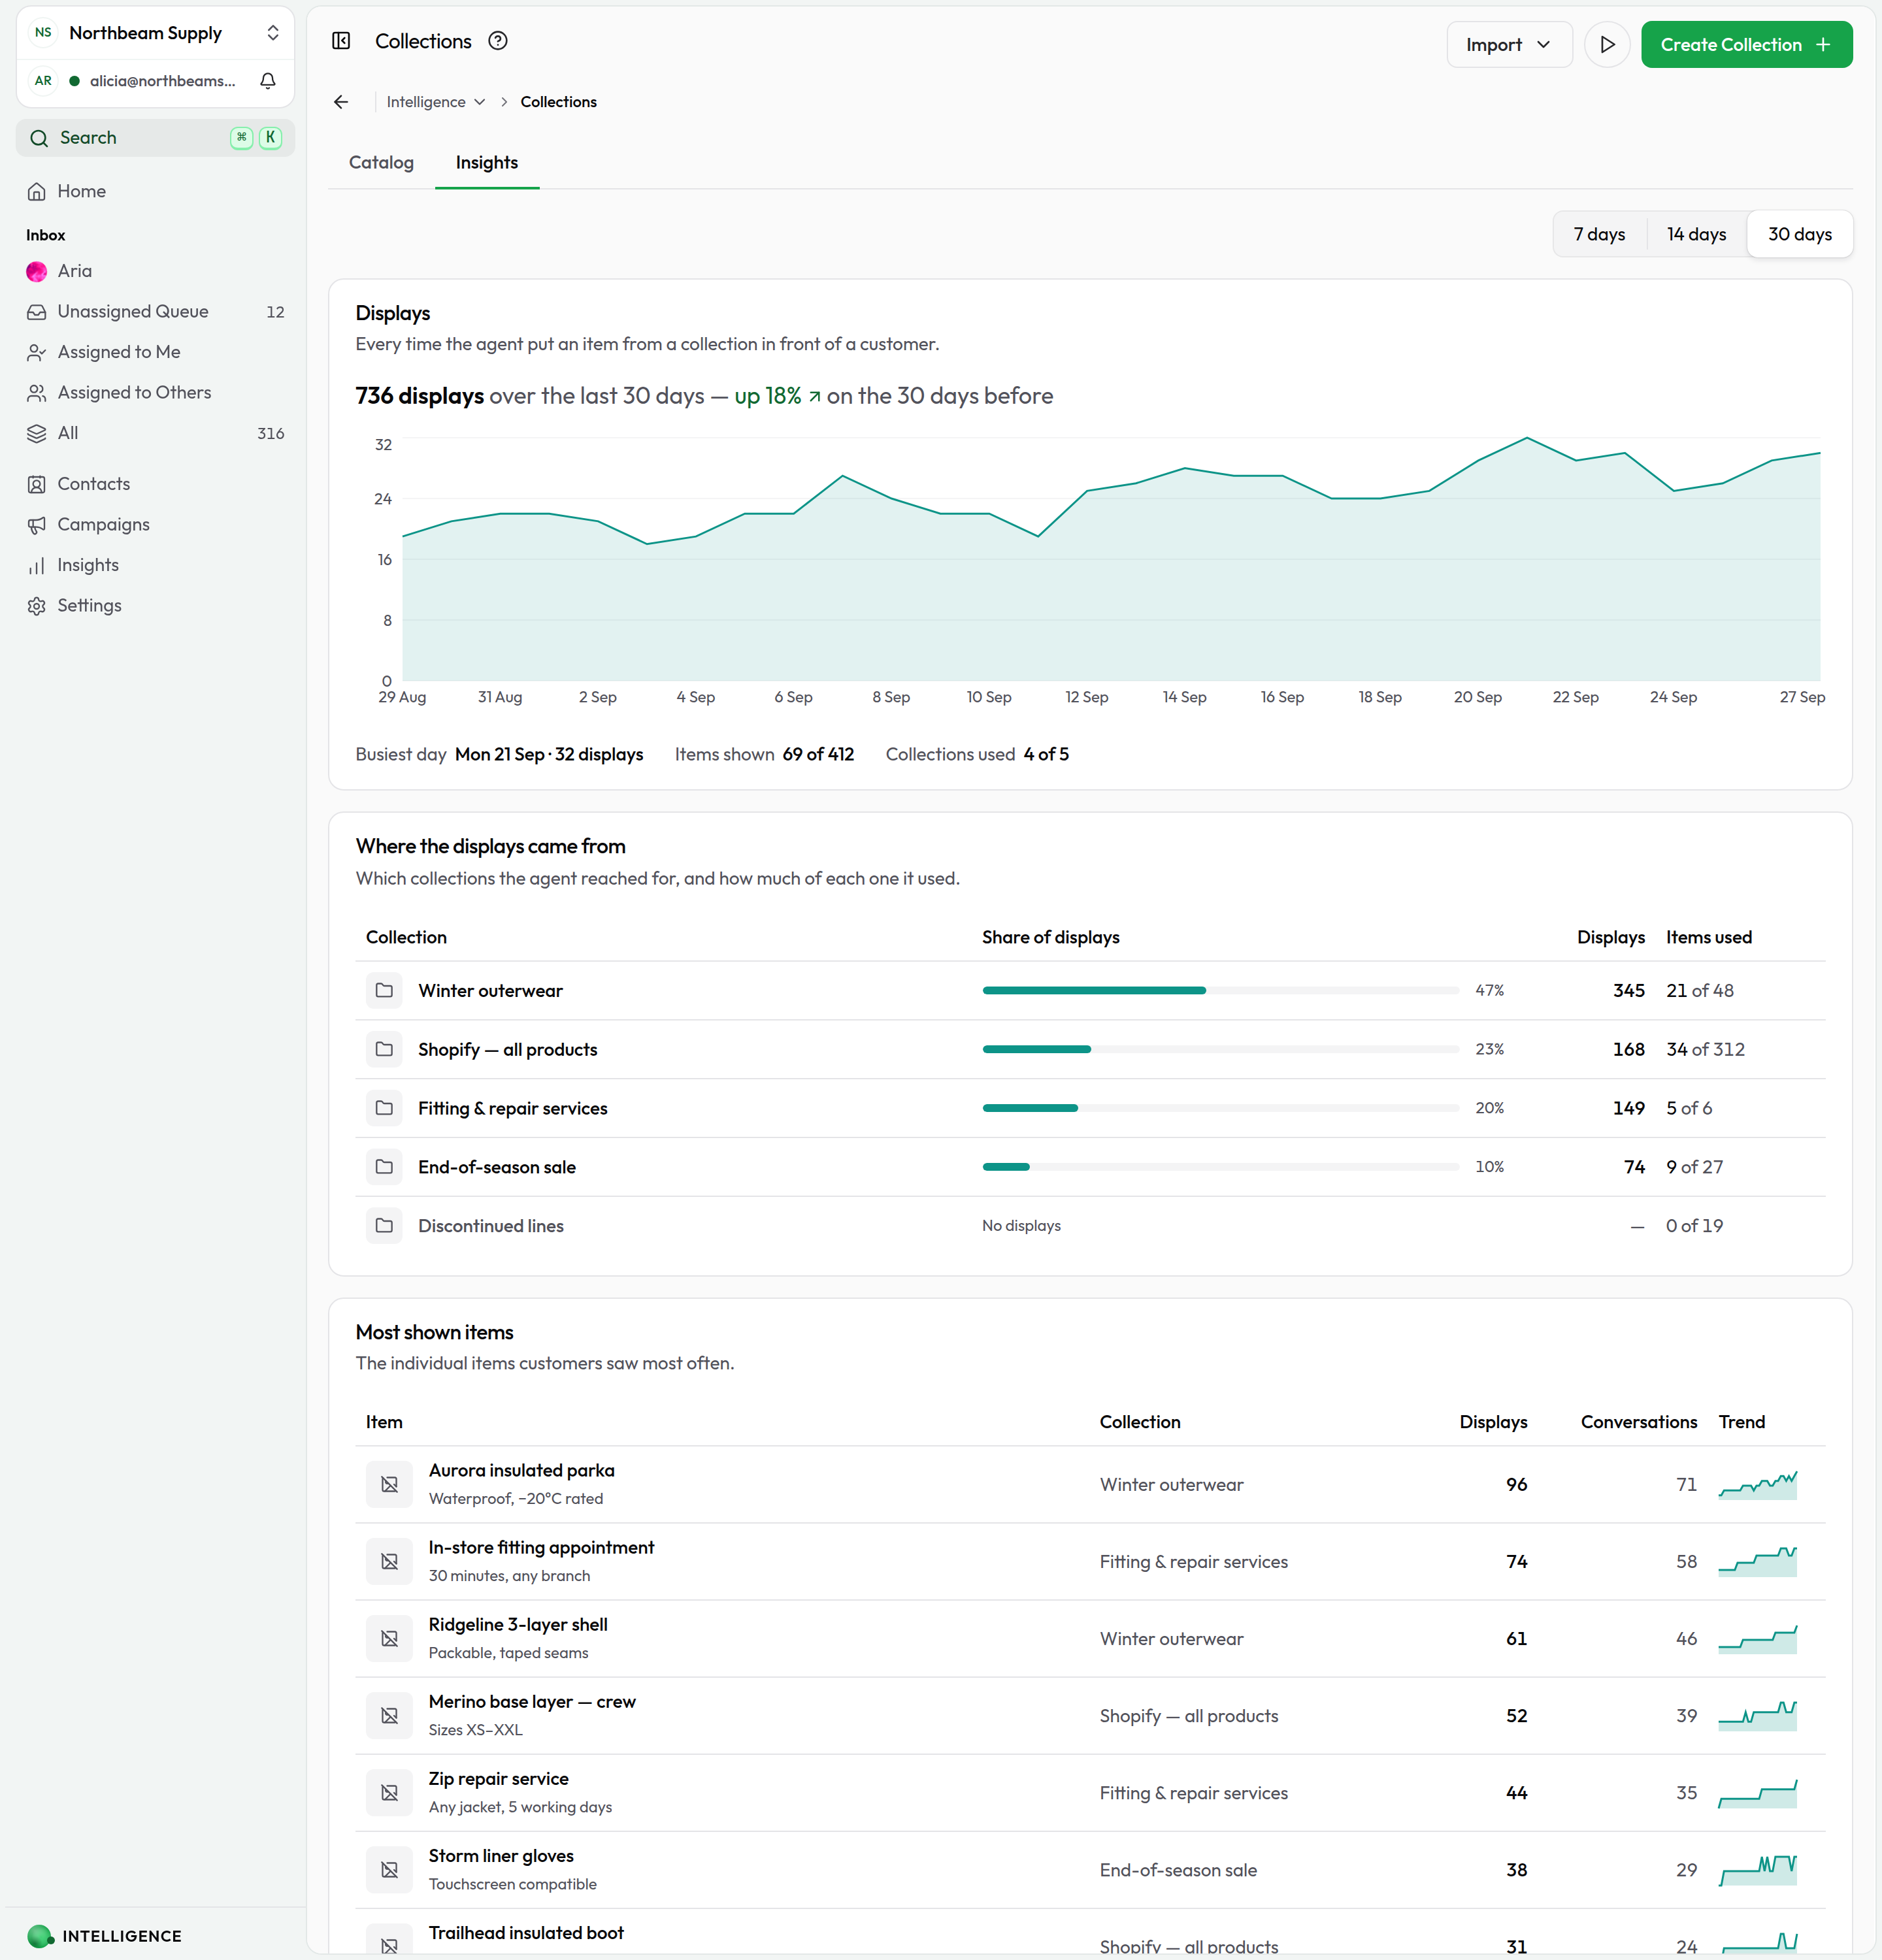
Every collection you build is a bet on what customers will ask for. Insights tells you which bets are paying off: how often the AI agent put something from your catalog in front of a customer, where those displays came from, and how much of what you built is being used at all.
It lives on the Collections page itself, as a tab beside the catalog — one page for your catalogs and their numbers, not two. That page sits under Intelligence → Collections, with the rest of the knowledge your agent draws on.
Open Collection Insights
- Open Intelligence from your dashboard.
- Select Collections under Knowledge.
- Switch to the Insights tab.
Pick a window at the top right — 7, 14, or 30 days. Every figure on the page follows it.
Displays
The headline counts every time the agent showed an item to a customer over the window, and compares it with the period immediately before, so a number has a direction and not just a size.
Below it, the daily chart shows the shape behind that total — a steady week reads differently from one that climbed on Thursday and stopped. Under the chart, three facts the total doesn't carry:
- Busiest day — the single day with the most displays
- Items shown — how many distinct items the agent reached for, out of everything in your catalog
- Collections used — the same, per collection
Items shown is the number to watch. A catalog of 400 items where 30 ever get shown isn't a demand problem — it usually means the other 370 need better titles and descriptions so the agent can find them.
Where the displays came from
A leaderboard of your collections, biggest first. Each row shows its share of all displays, the raw count, and how many of its items were used — 21 of 48 means the agent reached into that collection for 21 different items and never touched the other 27.
Collections with nothing to report stay in the list, marked No displays. They're the point: an untouched collection is either badly named or genuinely retired, and both are worth knowing.
Click any row to open that collection's items.
Most shown items
The individual items customers saw most often, with:
- Displays — times the agent showed the item
- Conversations — how many different conversations saw it, so a single chat that saw the same item four times counts once
- Trend — the daily shape over the window
Click a row to jump to that item's collection and edit its title, description, or whether it surfaces at all.
When there's no data yet
New or unreferenced collections show No displays, and a quiet workspace shows an empty report with the window control still available — try a longer one. Once the agent starts surfacing items in replies, the numbers fill in.
Related topics
- Collections — create and manage the items the AI agent can show
- Insights Overview — explore other analytics
- FAQ Insights — see how well your knowledge base is performing
- AI Agent — tune how the AI agent recommends items